The Power of Progression

The Power of Progression

The Progress Together 2026 Data Report

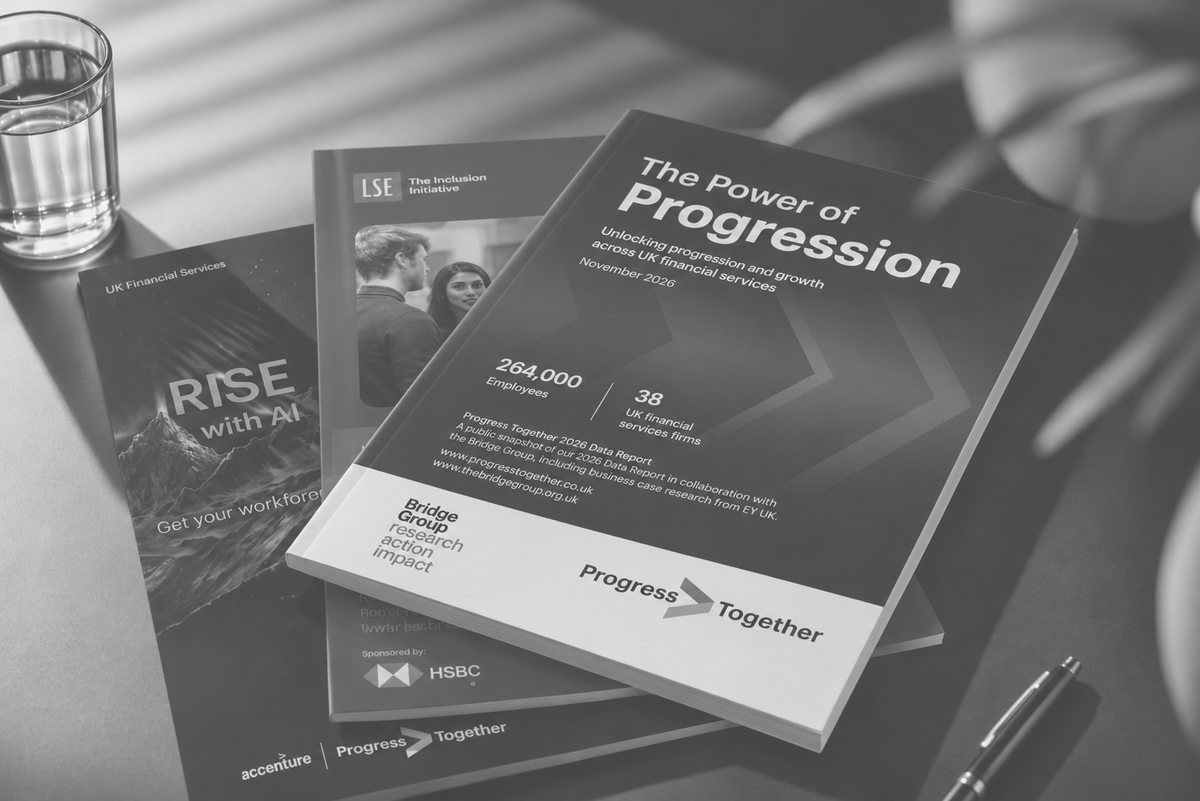
The Power of Progression is Progress Together’s 2026 Data Report on who progresses, who stays and who gets to lead in UK financial services.

Our findings draw on data shared by 38 of our member firms, covering 263,958 employees. For the fourth year running, we commissioned the Bridge Group to analyse our members’ data.

The findings show that opportunity narrows for people from lower socio-economic backgrounds as their careers progress. We set out what employers, government and regulators can do to change this, alongside EY’s research on the business case for socio-economic inclusion.

The Power of Progression – 2026 Data Report

  • The Power of Progression: Unlocking progression and growth across UK financial services
    PDF Data
    The Power of Progression: Unlocking progression and growth across UK financial services Drawing on data from 263,958 employees across 38 financial services firms, the report shows who progresses, who stays and who gets to lead. It finds that opportunity narrows as careers progress, and sets out what employers, government and regulators can do about it. Produced in collaboration with the Bridge Group, with supporting business-case research from EY.
  • The Power of Progression: Unlocking progression and growth across UK financial services (CEO and ExCo Summary)
    PDF Data Members Only
    The Power of Progression: Unlocking progression and growth across UK financial services (CEO and ExCo Summary) A short summary of the 2026 Data Report for chief executives and executive committee members. It sets out the key findings on progression, retention and leadership, and what senior leaders can do to act on them.
  • The Power of Progression: Unlocking progression and growth across UK financial services (Full Member Report)
    PDF Data Members Only
    The Power of Progression: Unlocking progression and growth across UK financial services (Full Member Report) Progress Together’s 2026 full member report with the Bridge Group, drawing on data from 263,958 employees across 38 financial services firms, examining socio-economic diversity in senior roles and the barriers to progression.

Eight findings from 263,958 employees

What the data shows about who progresses, who stays and who gets to lead.

  • Opportunity thins out

    Employees from lower socio-economic backgrounds are 32% of junior and 24% of senior employees. Representation of employees from higher socio-economic backgrounds rises from 50% to 60%.

  • Promotions are where it shows

    19% of middle-to-senior promotions, among firms submitting progression data, went to employees from lower socio-economic backgrounds.

  • Performance does not explain the whole gap

    Pilot, five firms: no consistent evidence of lower performance ratings for employees from lower socio-economic backgrounds.

  • People who progress tend to stay

    Pilot, six firms: roughly four times less likely to leave. Departure risk peaks in years two and three at approximately 25% higher. An association, not a proven cause.

  • Where you work matters

    82% of junior roles are outside London; 61% of senior roles are in London. Senior roles are 17% of roles in London and 7% elsewhere.

  • Barriers stack up

    White employees from higher socio-economic backgrounds are around 28 times more likely to be in senior roles than ethnic minority employees from lower socio-economic backgrounds.

  • There is a business case

    EY’s research identifies five material risks of inaction and five opportunities.

  • Employers can start now

    47% of participating firms need support using socio-economic data to assess fair progression. The report sets out questions to Ask, Act on and Measure.

Performance and retention findings are pilot analyses of five and six firms and do not represent the sector as a whole.

Infographics to share

Download the graphics and use them in your own posts and presentations.

Front cover of Progress Together’s 2026 Data Report, The Power of Progression.

The Power of Progression

Progress Together’s 2026 Data Report, made in collaboration with the Bridge Group and including business case research from EY.

Post wording

Progress Together’s 2026 Data Report, The Power of Progression, is out today. Produced in collaboration with the Bridge Group and incorporating business-case research from EY, it draws on data from 263,958 employees across 38 financial services firms.

It shows that employees from lower socio-economic backgrounds are 32% of junior employees and 24% of senior employees.

The report asks every leadership team three questions: Who progresses? Who stays? Who gets to lead?

Read the report from @Progress Together: https://progresstogether.co.uk/pages/member-file/the-power-of-progression-unlocking-progression-and-growth-across-uk-financial-services

#ThePowerOfProgression #TalentIsEverywhere #SocioEconomicInclusion #FinancialServices

Graphic from Progress Together’s 2026 Data Report showing that 19% of middle-to-senior promotions went to employees from lower socio-economic backgrounds, based on firms submitting progression data.

Who progresses?

Among firms submitting progression data, 19% of middle-to-senior promotions went to employees from lower socio-economic backgrounds.

Post wording

Promotions are where the gap shows.

In the firms that submitted progression data for Progress Together’s 2026 Data Report, The Power of Progression, 19% of middle-to-senior promotions went to employees from lower socio-economic backgrounds. Across all firms in the report, those employees are 32% of junior employees and 24% of senior employees.

Read the report from @Progress Together: https://progresstogether.co.uk/pages/member-file/the-power-of-progression-unlocking-progression-and-growth-across-uk-financial-services

#ThePowerOfProgression #SocioEconomicInclusion #FinancialServices

Graphic from Progress Together’s 2026 Data Report showing that, in a pilot of six firms, employees who progressed were roughly four times less likely to leave, and that departure risk for employees from lower socio-economic backgrounds peaks in years two and three at approximately 25% higher than for intermediate background peers.

Who stays?

In a pilot analysis of 20,700 current and former employees across six firms, employees who had progressed were roughly four times less likely to leave. This is an association and does not establish that stalled progression causes people to leave.

Post wording

Progression and retention are closely linked.

In a pilot analysis of 20,700 current and former employees across six firms, Progress Together’s 2026 Data Report, The Power of Progression, found that employees who had progressed were roughly four times less likely to leave.

The same analysis found that departure risk for employees from lower socio-economic backgrounds peaks in years two and three at approximately 25% higher than for intermediate background peers, and that the difference disappears by years eight to ten.

Progress Together notes that this is an association and does not establish that stalled progression causes attrition. Pilot findings come from six firms and do not represent the sector as a whole.

Read the report from @Progress Together: https://progresstogether.co.uk/pages/member-file/the-power-of-progression-unlocking-progression-and-growth-across-uk-financial-services

#ThePowerOfProgression #SocioEconomicInclusion #FinancialServices

Graphic from Progress Together’s 2026 Data Report showing that 82% of junior roles are outside London and 61% of senior roles are in London, with senior positions making up 17% of roles in London and 7% elsewhere in the UK.

Who gets to lead?

82% of junior roles are based outside London and 61% of senior roles are in London. Senior positions account for 17% of roles in London and 7% elsewhere in the UK.

Post wording

Senior roles in financial services are concentrated in London.

Progress Together’s 2026 Data Report, The Power of Progression, shows that 82% of junior roles are based outside London, and 61% of senior roles are in London. Senior positions account for 17% of roles in London, compared with 7% elsewhere in the UK.

Progress Together calls for regional jobs to become regional careers, and regional careers to become future leaders.

Read the report from @Progress Together: https://progresstogether.co.uk/pages/member-file/the-power-of-progression-unlocking-progression-and-growth-across-uk-financial-services

#ThePowerOfProgression #SocioEconomicInclusion #FinancialServices

Quotes

  • “The question for financial services leaders is not simply whether socio-economic inclusion matters, but what value firms risk leaving on the table when talent and perspective are overlooked. In a sector navigating rapid technological, regulatory and economic change, widening opportunity can strengthen decision-making, resilience and long-term competitiveness.”

    Chris Woolard CBE, EY UK LLP Board Member and Partner, Financial Services
  • “This research shifts the conversation from who enters financial services to whether talent has an equal opportunity to progress and lead once inside. Our pilot analysis points to progression, rather than performance ratings, as a key bottleneck and when progression stalls, valuable talent leaves. By showing us where pathways narrow regionally and across career stages, this data provides the sector with an essential foundation for targeted action.”

    Jenny Baskerville, Chief Executive, The Bridge Group
  • “I would encourage every leadership team reading this report to ask three questions: Who progresses? Who stays? Who gets to lead?”

    Vincent Keaveny CBE, Chair, Progress Together